
When the app opens click on the desired NRT-8000 device and then the CONNECT button at the bottom of the pop up window.
If you want to change devices you can get back to this window by clicking the NRT Logo (the Connections & Preferences) icon in the upper left corner of the main window.
The app will then connect to the desired device. On the first time the app is run or if the app does not find the appropriate calibration, a drop down window will open prompting you load the missing cal file. The best way to make sure you have the latest cal file is to download from the internet.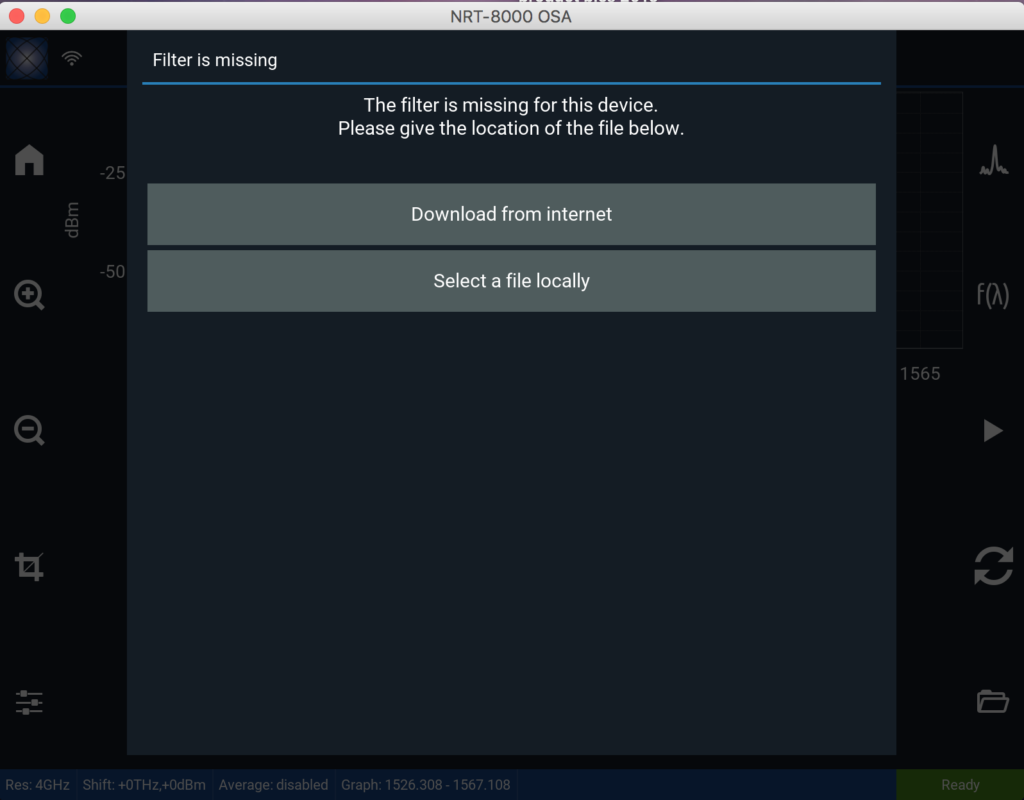
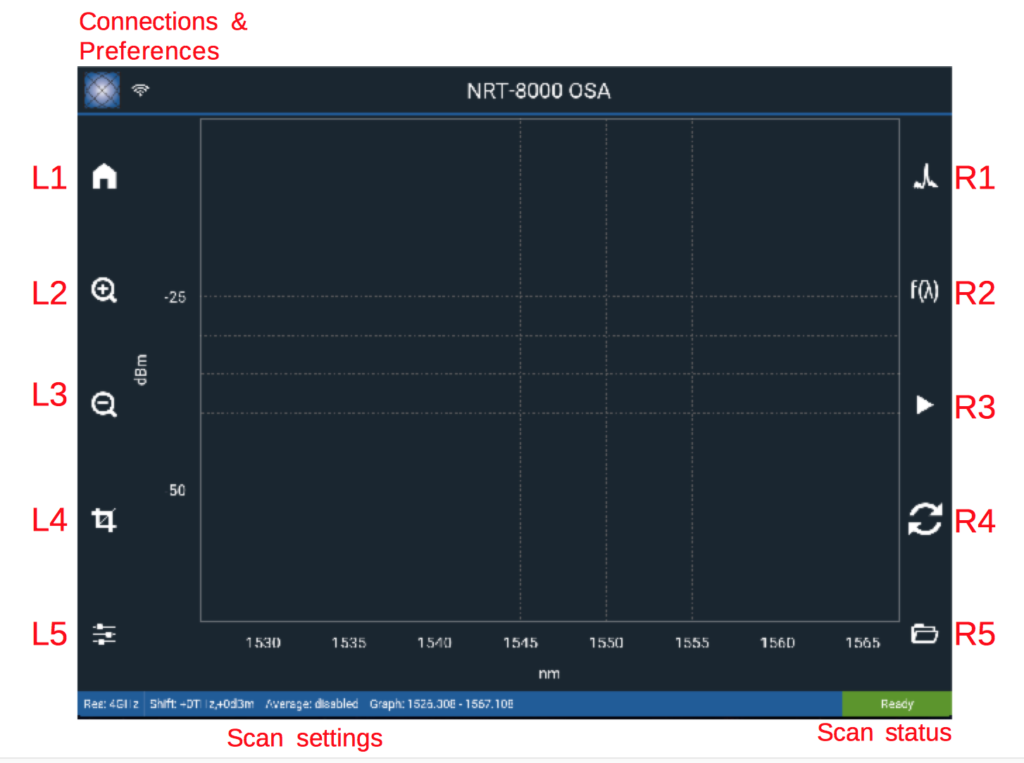
Measurement related buttons on Right:
- R1 toggles between spectrum and ITU channel measurements.
- R2 f(λ) analysis functions opens pop up window to set parameters for Peak Search and OSNR analyses
- R3 Scan spectrum – Press the play button for single scan. The box at the low right of the window will turn orange when connecting or scanning, and turn green then the scan is complete and the unit is ready.
- R4 Repeat scan The box at the low right of the window will turn orange when scanning. Click R-4 again to exit repeat scan mode.
- R5 File options – save, open and share files in 3 formats .nrt (binary), .csv, and .png
Configuration/Set-Up buttons on Left:
- L1 Home – Resets x-y display to setting (L5) values.
- L2 Zoom in
- L3 Zoom out
- L4 Crop tool. Press crop icon, select a rectangle of interest on the spectrum, and re-click to crop tool to zoom into the set rectangle.
- L5 Settings:
(a) X max, min and units,
(b) Y max, min and units,
(c) Resolution,
(d) Scan averaging (akin to sensitivity on Yokogawa) This requires repeat scan R4,
(e) X and Y scale offset,
(f) data logging. This requires repeat scan R4,
(g) OSNR calibration – used to try to match OSNR calculations to a reference OSA. (This feature is used especially to match OSNRs to a golden standard unit.)